
data-src in this blockInvestment proposal
Sirena Gramado
Masterplan valuation and entry proposal for 25% of the project: a 205-hectare destination in Gramado's new centrality, anchored by the first Club Med Exclusive Collection in the Americas.
Estimated projection Figures from the Financial Model (Oct/2026), subject to revision · open the model (.xlsx) · Portuguese version
Project concept
Nine businesses anchored by Club Med
A 205-hectare destination district, with hospitality, entertainment, events, income assets and real estate development in three phases. Club Med brings a continuous flow of high-income tourists and makes the land and the other businesses viable.
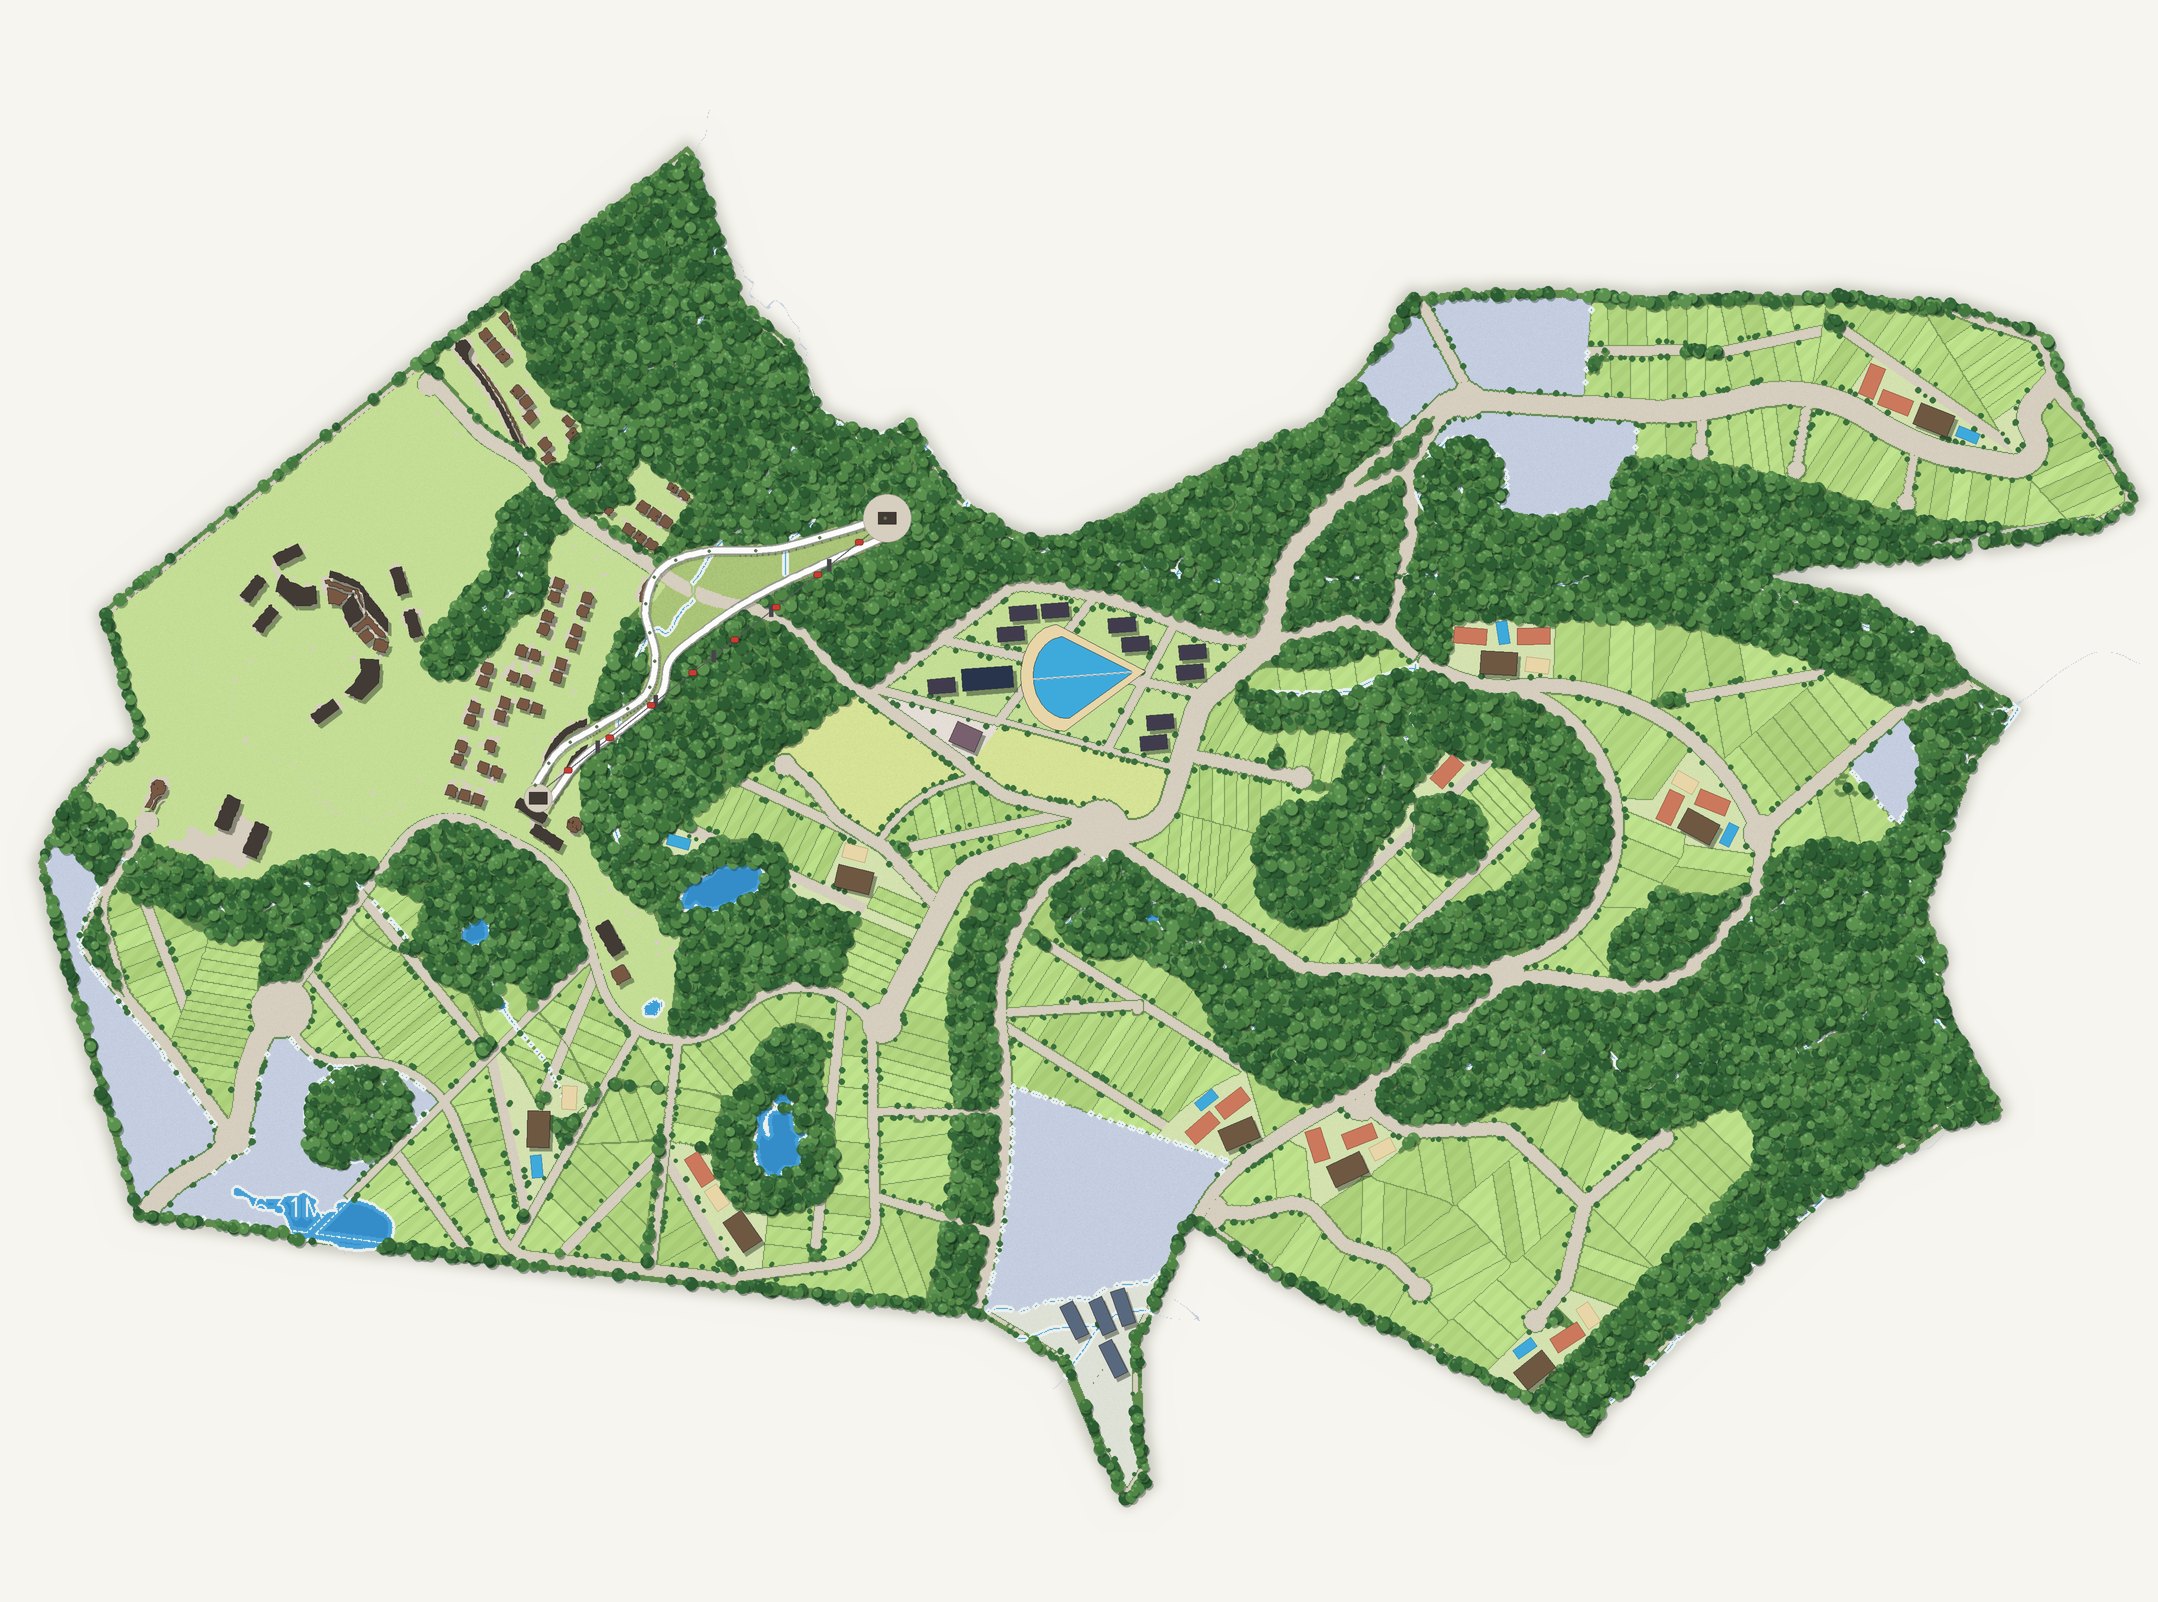
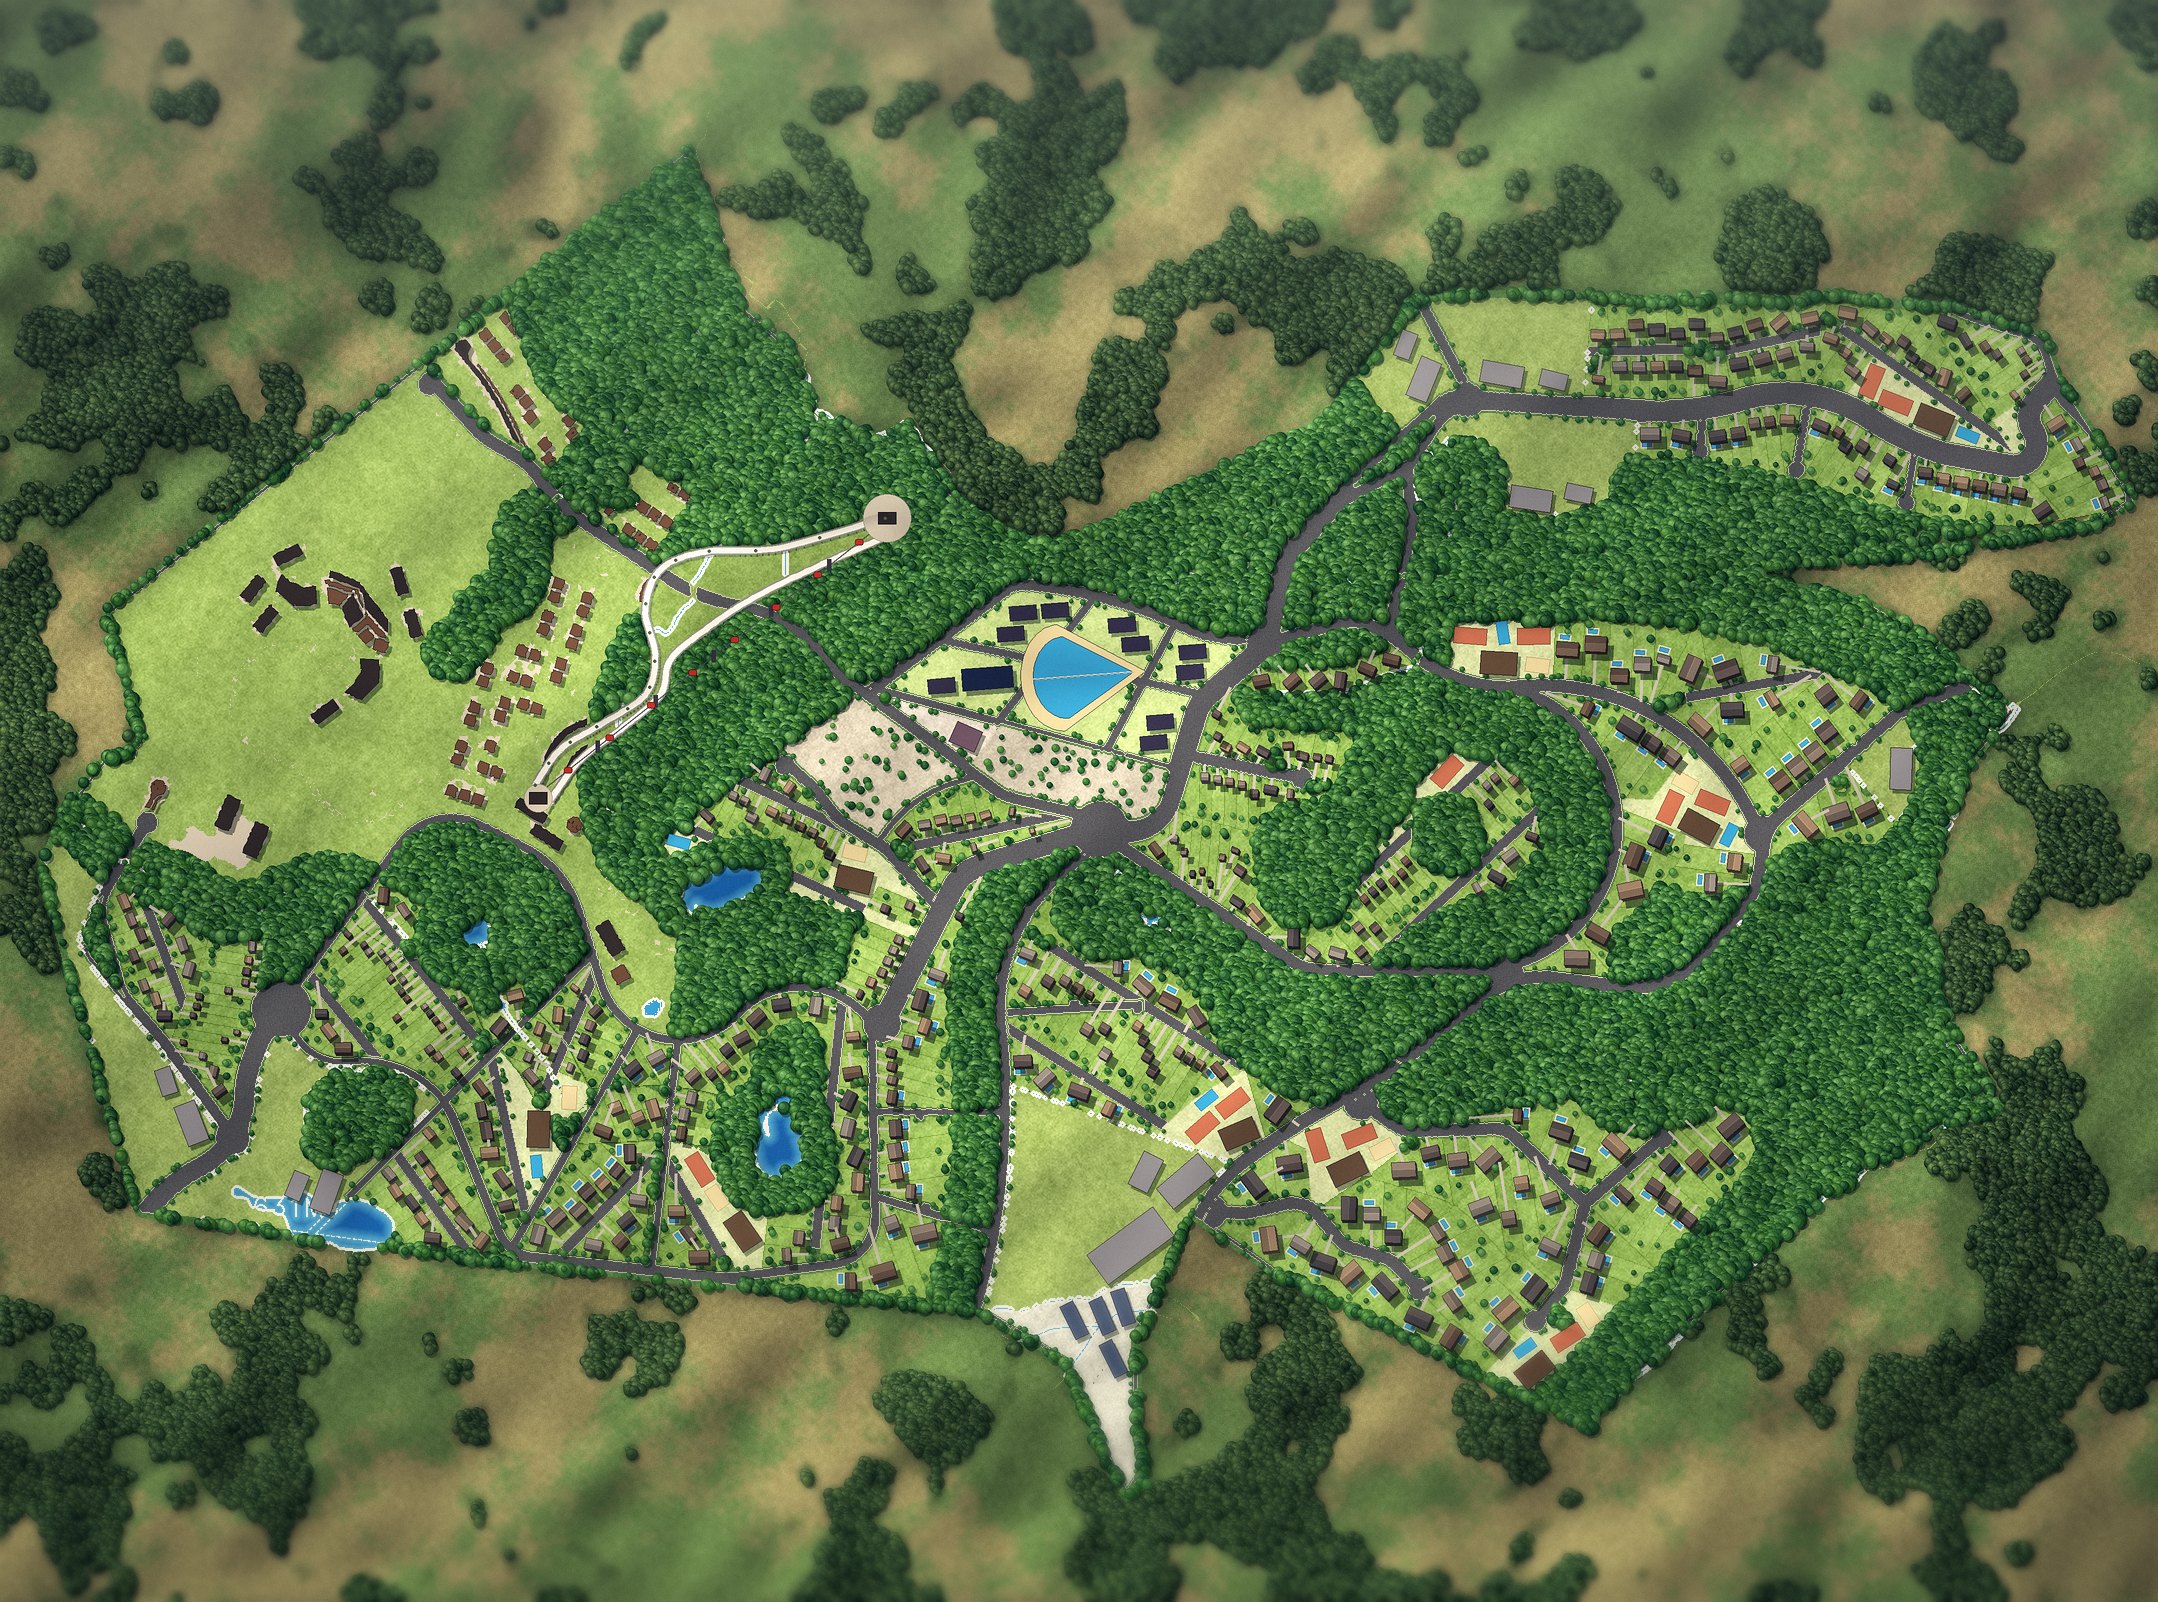
Map from the masterplan study (sirenagramado.netlify.app, Oct/2026). Figures per community come from the Real Estate study and may differ from the consolidated financial model.
Hospitality
Club Med Gramado
250 rooms · 18-year BTS contract
Real Estate
Club Med Villas
26 houses · sales value R$ 142.8 MM
Entertainment
Ski Gramado
1st all-season ski complex
Events
WDC Weddings
112 → 202 events per year
Income
Mini Mall
1,750 m² of GLA between the squares
Real Estate
Land Lots
372 lots · 3 phases · sales value R$ 1,063.5 MM
Real Estate
Apartments (Surf Village)
257 apartments · 3 phases · sales value R$ 957.3 MM
Income
Senior Living
90 serviced units
Events
Convention Center
7,500 m² · 1,200-seat auditorium
Source: Sirena Gramado Financial Model (Oct/2026). Sales value at each phase's launch prices. Each business is developed in its own SPV.
Location
In Gramado's new centrality, on the way to the new airport
data-src in this block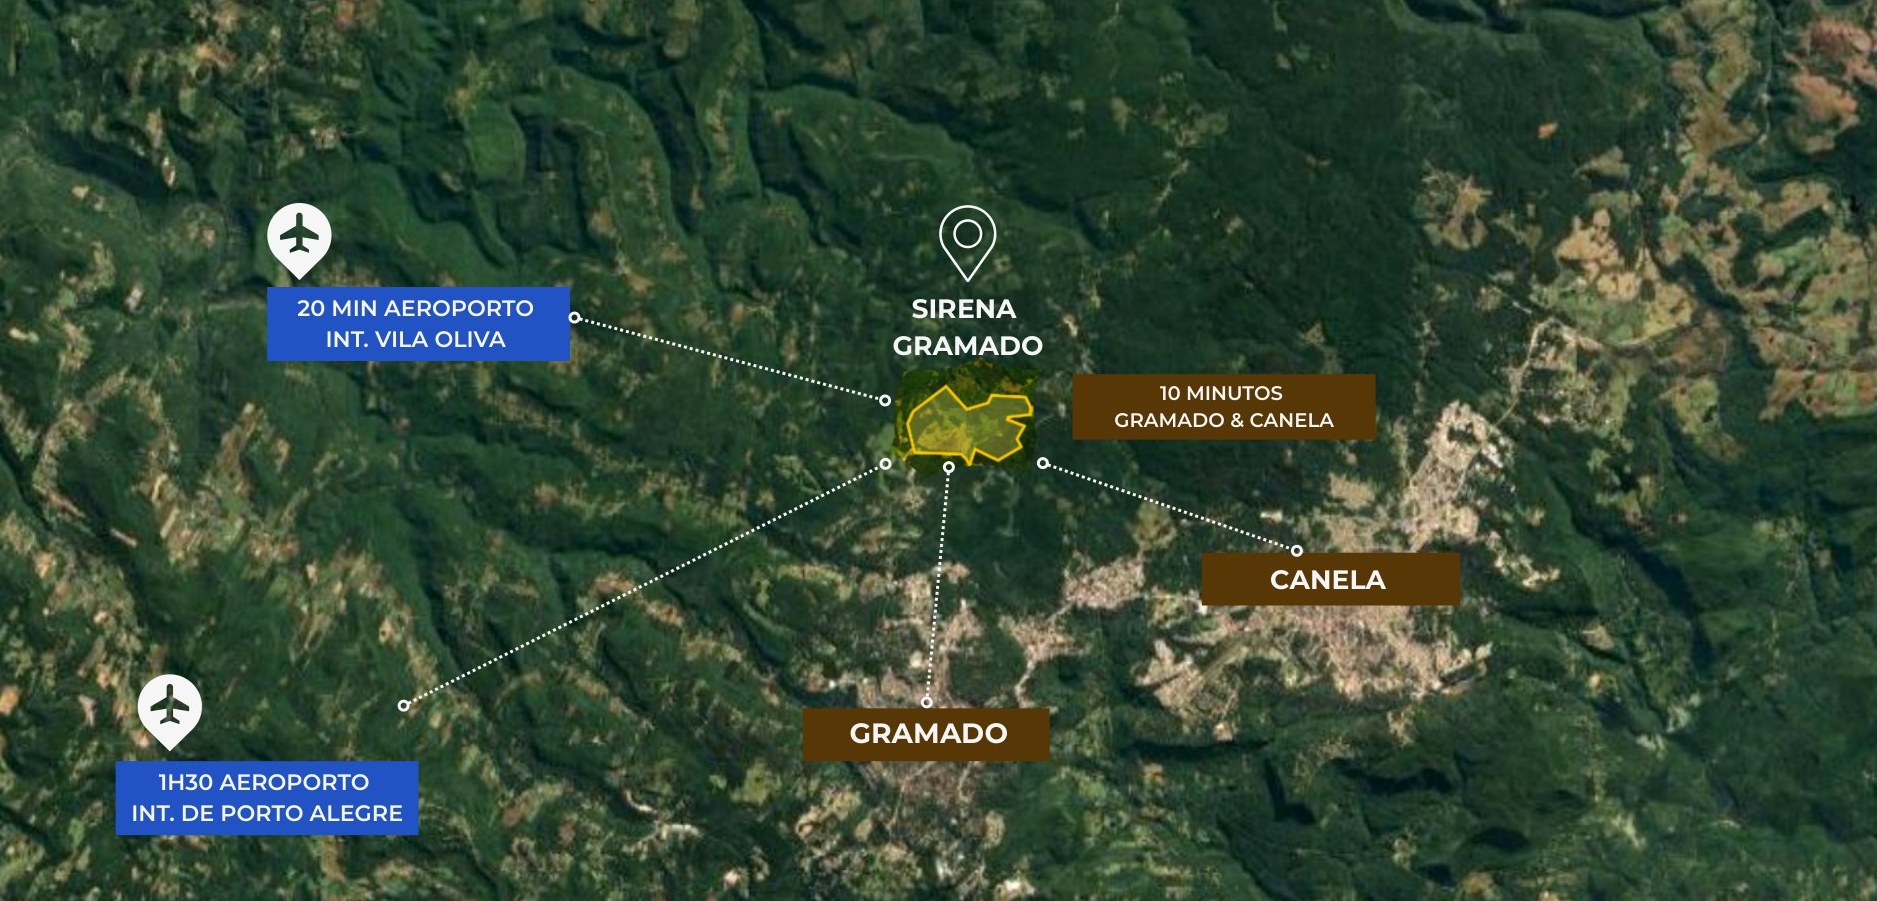
Distances from the site: Gramado and Canela, Vila Oliva airport and Porto Alegre.
Gramado's New Centrality
Sirena Gramado accounts for more than 20% of Gramado's New Centrality, the growth axis the municipality has defined for the city
Of the roughly 900 hectares of the New Centrality Regional Urban Plan, approved unanimously by the City Council in May 2026 in the direction of the future Vila Oliva airport, 205 hectares belong to Sirena Gramado. Agreement 01/2025 with the Municipality already places the civic square and the hospital and education complex of the new centrality on the site, and all the public infrastructure of the new growth vector runs through our land.
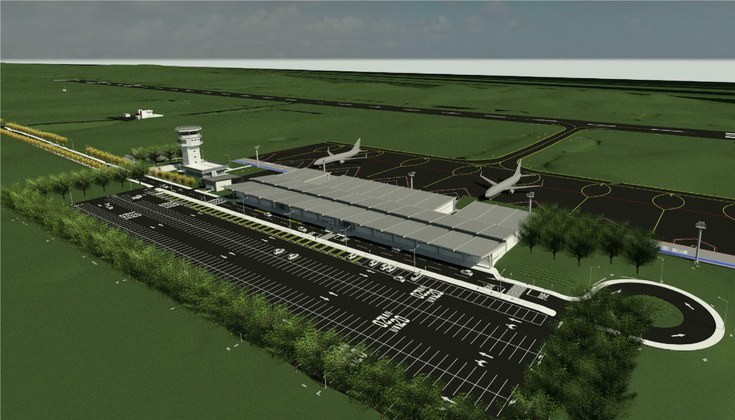
Design of the Serra Gaúcha Regional Airport, in Vila Oliva (Caxias do Sul).
Serra Gaúcha Regional Airport
Vila Oliva: commercial jets 20 minutes from the site
- Direct flights to the Serra: today the reference airport is Porto Alegre, 1h30 away.
- Expands the audience for Club Med, events and second homes beyond the state of RS.
- FlyBIS vertiport in the complex (protocol with the city), with eVTOL from 2028.
- None of this is priced into the current valuation.
Sources: Jornal do Comércio (13/10/2026 and 01/09/2026); Panrotas (30/12/2025); Agreement 01/2025.
Schedule and structure
Three stages, from 2026 to 2035
Stage 1 · 2026–28 (Club Med opening) · Stage 2 · 2029–30 · Stage 3 · 2031–35. Source: Financial Model (Oct/2026).
Ownership structure by vertical
Four verticals, one SPV per business
Land
Club Med
Phase 01 · buys 25% of the valuation
Ski + Real Estate · partner in the exposure
Each project in its own SPV, with a Star Ópera development fee. In Phase 01 the investor buys 25% of the valuation and follows 25% of the cash flow; in the Ski and Real Estate it joins as a partner in 25% of the cash exposure, without paying valuation. SPV structure to be defined with the investor.
Investment proposal Estimated projection
25% of the project for US$ 58.6 MM at entry
Entry at today's valuation in the land, the hotel and Phase 01; in Ski Gramado and Real Estate the investor joins as a partner in 25% of the cash exposure, without paying valuation.
1. Entry · purchase of 25% of the valuation
2. Partner in 25% of the cash exposure · no valuation paid
Estimated projection. Exchange rate R$ 5.00/US$. Contributions and distributions from 2026 to 2045, without perpetuity; the Ski still generates income after 2045. Source: INVESTOR tab.
Land
25% of Sierra Paradisus, owner of the 205-ha parcel, at market value: the land goes into the projects at no cost.
Hotel
5.5% cap rate: 25% of operating income after tax, free of capex and debt, R$ 9.3 MM/year in 2033 (market yield). With the contract indexed to IPCA, income rises to R$ 25 MM/year in 2045.
Phase 01 *
Buys 25% of the NPV of cash flows at 9% p.a. and keeps 25% of the result: WDC Weddings, Villas, Mini Mall, Senior Living and Convention Center, following each SPV's cash flow.
Ski Gramado and Real Estate
No valuation paid: takes a 25% stake by contributing 25% of each SPV's cash exposure and receives 25% of the result — Ski Gramado, Land Lots and Apartments (Surf Village), across the three phases.
Investor return · consolidated Estimated projection
What goes in, what is contributed and what comes back, 2026–2045
| Investor net cash flow | 2026 | 2027 | 2028 | 2029 | 2030 | 2031 | 2032 | 2033 | 2034 | 2035 | 2036 | 2037 | 2038 | 2039 | 2040 | 2041 | 2042 | 2043 | 2044 | 2045 |
|---|---|---|---|---|---|---|---|---|---|---|---|---|---|---|---|---|---|---|---|---|
| R$ MM | (293.3) | (8.5) | (6.1) | (24.3) | 11.3 | 42.1 | 28.1 | 62.8 | 35.3 | 83.5 | 34.3 | 17.8 | 18.1 | 18.5 | 18.8 | 19.2 | 19.6 | 20.0 | 20.5 | 20.9 |
| US$ MM | (58.7) | (1.7) | (1.2) | (4.9) | 2.3 | 8.4 | 5.6 | 12.6 | 7.1 | 16.7 | 6.9 | 3.6 | 3.6 | 3.7 | 3.8 | 3.8 | 3.9 | 4.0 | 4.1 | 4.2 |
Estimated projection · Investor net cash flow · R$ MM · entry, contributions and distributions, 2026–2045
Estimated projection. Investor's peak cash exposure of R$ 332.3 MM in 2029; cumulative cash positive from 2038. Multiple = inflows (including the perpetuity) ÷ cash outflows; perpetuity = 2045 income of Club Med, WDC and Ski ÷ 5.5% cap rate. Source: INVESTOR tab.
* Note on the valuation perimeter
The Phase 01 projects (WDC Weddings, Villas, Mini Mall) and the Stage 2 projects (Senior Living and Convention Center) are still being defined, and the value attributed to them in this material (R$ 126.4 MM, corresponding to the NPV of projected cash flows at 9% p.a.) was determined on conservative assumptions, based on the current stage of the masterplan. The reference value of the perimeter acquired at entry (land, Club Med and these projects) is fixed contractually on that date.
Should the valuation determined upon the final definition of the masterplan, expected in 2028, exceed the reference value, maintaining the investor's 25% stake will be conditional on a complementary contribution equal to 25% of the difference. If the contribution is not made, the investor's stake will be adjusted proportionally, subject to the valuation criteria and dilution mechanisms to be set out in the definitive agreements. Ski Gramado, Land Lots and Apartments (Surf Village) are not part of the valuation perimeter: in those, the investor participates as a partner in 25% of the cash exposure, with no valuation paid at entry.
Masterplan valuation Estimated projection
Four verticals, R$ 1,515 MM of value
Each asset is valued by the method suited to its nature and the business value is the sum of the parts, brought to 2026 present value.
Sierra Paradisus
Land
R$ 250.0 MM16.5% · US$ 50.0 MM
205-ha parcel with approved masterplan, at market value
Buys 25% of the valuation
DC Paradisus
Club Med
R$ 675.8 MM44.6% · US$ 135.2 MM
250-room hotel · stabilized income ÷ 5.5% cap rate
Buys 25% of the valuation
Phase 01 SPVs
Phase 01
R$ 126.4 MM8.3% · US$ 25.3 MM
WDC Weddings, Villas, Mini Mall, Senior Living and Convention Center · NPV at 9% p.a.
Buys 25% of the valuation *
Ski Gramado + Real Estate
Partner in the exposure
R$ 463.3 MM30.6% · US$ 92.7 MM
Ski Gramado, Land Lots and Apartments (Surf Village), 3 phases · no valuation paid
Contributes 25% of the cash exposure and receives 25% of the result
1. Income assets
Club Med, Ski Gramado and WDC Weddings: stabilized income ÷ 5.5% cap rate. Club Med enters at market value; the others are brought to 2026 present value at 9% p.a.
2. Development and closed cycle
Villas, Land Lots and Apartments (Surf Village), in three phases each, Mini Mall (built, operated for three years and sold in 2030), Senior Living and Convention Center: full NPV of cash flows at 9% p.a., no terminal value.
3. Land
Parcel already paid for by the Group, valued at market at R$ 250 MM, with approved masterplan and contracted anchor.
Sum of the parts · value composition by vertical
Value asset by asset, in each SPV
| Asset | Method | Value 100% R$ MM | Entry 25% R$ MM | Contributions as partner 2026–45 | Distributions 2026–45 | % of total |
|---|---|---|---|---|---|---|
| Land · Sierra Paradisus | 250.0US$ 50.0 | 62.5US$ 12.5 | — | — | 16.5% | |
| Parcel with masterplan | Market | 250.0US$ 50.0 | 62.5US$ 12.5 | — | — | 16.5% |
| Club Med · DC Paradisus | 675.8US$ 135.2 | 168.9US$ 33.8 | — | 163.8US$ 32.8 | 44.6% | |
| Club Med Gramado | Cap ratestabilized income | 675.8US$ 135.2 | 168.9US$ 33.8 | — | 163.8US$ 32.8 | 44.6% |
| Phase 01 · buys 25% of the valuation | 126.4US$ 25.3 | 31.6US$ 6.3 | 27.7US$ 5.5 | 71.4US$ 14.3 | 8.3% | |
| WDC Weddings | Cap ratestabilized income | 89.1US$ 17.8 | 22.3US$ 4.5 | 4.2US$ 0.8 | 31.5US$ 6.3 | 5.9% |
| Club Med Villas | NPV | 27.5US$ 5.5 | 6.9US$ 1.4 | 4.4US$ 0.9 | 13.8US$ 2.8 | 1.8% |
| Mini Mall | NPV · sale 2030 | 4.9US$ 1.0 | 1.2US$ 0.2 | 5.4US$ 1.1 | 8.6US$ 1.7 | 0.3% |
| Senior Living | NPV | 2.7US$ 0.5 | 0.7US$ 0.1 | 7.6US$ 1.5 | 9.6US$ 1.9 | 0.2% |
| Convention Center | NPV | 2.2US$ 0.4 | 0.6US$ 0.1 | 6.2US$ 1.2 | 7.8US$ 1.6 | 0.1% |
| Ski Gramado + Real Estate · partner in 25% of the exposure | 463.3US$ 92.7 | — | 118.8US$ 23.8 | 343.0US$ 68.6 | 30.6% | |
| Ski Gramado | Cap ratestabilized income | 189.9US$ 38.0 | — | 33.3US$ 6.7 | 109.9US$ 22.0 | 12.5% |
| Land Lots P01 | NPV | 32.2US$ 6.4 | — | 8.7US$ 1.7 | 23.0US$ 4.6 | 2.1% |
| Apartments (Surf Village) P01 | NPV | 31.9US$ 6.4 | — | 11.0US$ 2.2 | 26.1US$ 5.2 | 2.1% |
| Land Lots P02 | NPV | 92.7US$ 18.5 | — | 17.4US$ 3.5 | 63.4US$ 12.7 | 6.1% |
| Apartments (Surf Village) P02 | NPV | 35.9US$ 7.2 | — | 11.8US$ 2.4 | 31.4US$ 6.3 | 2.4% |
| Land Lots P03 | NPV | 41.8US$ 8.4 | — | 24.2US$ 4.8 | 52.0US$ 10.4 | 2.8% |
| Apartments (Surf Village) P03 | NPV | 38.9US$ 7.8 | — | 12.5US$ 2.5 | 37.2US$ 7.4 | 2.6% |
| Total SOTP — business valuation | 1.515.5US$ 303.1 | 263.0US$ 52.6 | 146.6US$ 29.3 | 578.2US$ 115.6 | 100% |
Estimated projection. R$ million at 2026 present value, 9% p.a. discount rate and 5.5% cap rate, exchange rate R$ 5.00/US$. Source: VALUATION and INVESTOR tabs of the Financial Model (Oct/2026). Pre-money valuation; the R$ 30 MM structuring fee is not part of the valuation. Entry 25% = price paid at entry for the perimeter assets; contributions and distributions = 25% of each SPV's negative and positive cash, 2026–2045, without perpetuity.
Returns and cash flows Estimated projection
The consolidated masterplan
| Business | IRR | Exposure · R$ MM | Result 26–45 · R$ MM | Multiple |
|---|---|---|---|---|
| Club Med Gramado | 8.4% | (222.4)(US$ 44.5) | 139.8US$ 28.0 | 1.63x |
| Club Med Villas | 91.5% | (17.5)(US$ 3.5) | 37.8US$ 7.6 | 3.16x |
| Ski Gramado | 18.0% | (133.3)(US$ 26.7) | 306.2US$ 61.2 | 3.30x |
| WDC Weddings | 32.1% | (16.6)(US$ 3.3) | 109.5US$ 21.9 | 7.58x |
| Mini Mall | 18.0% | (21.8)(US$ 4.4) | 12.8US$ 2.6 | 1.59x |
| Land Lots | 57.3% | (52.7)(US$ 10.5) | 352.5US$ 70.5 | 2.75x |
| Apartments (Surf Village) | 45.8% | (47.2)(US$ 9.4) | 237.8US$ 47.6 | 2.69x |
| Senior Living | 18.1% | (30.2)(US$ 6.0) | 8.0US$ 1.6 | 1.27x |
| Convention Center | 18.1% | (24.8)(US$ 5.0) | 6.6US$ 1.3 | 1.27x |
| Consolidated | 19.5% | (432.4)(US$ 86.5) | 1.211.0US$ 242.2 | 3.80x |
Estimated projection. R$ million. Equity IRR of each project; result = sum of 2026–2045 cash flows; cash flows excluding the land cost (R$ 100 MM, already paid by the Group). Land Lots and Apartments multiple on the capital of the 3 phases. Consolidated exposure is lower than the sum of exposures because the projects generate cash at different times. Source: MANAGEMENT tab.
Holding cash flow · 2026–2045 Estimated projection
Cumulative cash positive from 2033
| R$ MM | 2026 | 2027 | 2028 | 2029 | 2030 | 2031 | 2032 | 2033 | 2034 | 2035 |
|---|---|---|---|---|---|---|---|---|---|---|
| Hospitality | (84.5) | (137.9) | 15.4 | 5.1 | 1.3 | 11.2 | 12.0 | 13.9 | 14.6 | 15.4 |
| Real Estate | (1.2) | (20.8) | 1.4 | (27.2) | (1.8) | 37.4 | 48.6 | 185.1 | 73.9 | 265.4 |
| Entertainment | 0.0 | 0.0 | (54.4) | (78.9) | 18.0 | 19.1 | 20.1 | 21.3 | 22.4 | 23.7 |
| Events | 0.0 | (16.6) | 2.7 | (5.9) | (9.9) | 37.7 | 7.7 | 7.7 | 7.7 | 7.7 |
| Income | 0.0 | (21.8) | 2.2 | (10.0) | 12.1 | 38.3 | 0.0 | 0.0 | 0.0 | 0.0 |
| Cash flow for the year | (85.7) | (197.1) | (32.7) | (116.9) | 19.7 | 143.6 | 88.4 | 228.0 | 118.7 | 312.1 |
| Cash flow for the year · US$ MM | (17.1) | (39.4) | (6.5) | (23.4) | 3.9 | 28.7 | 17.7 | 45.6 | 23.7 | 62.4 |
| Cumulative | (85.7) | (282.8) | (315.5) | (432.4) | (412.6) | (269.0) | (180.6) | 47.4 | 166.1 | 478.2 |
| Cumulative · US$ MM | (17.1) | (56.6) | (63.1) | (86.5) | (82.5) | (53.8) | (36.1) | 9.5 | 33.2 | 95.6 |
| R$ MM | 2036 | 2037 | 2038 | 2039 | 2040 | 2041 | 2042 | 2043 | 2044 | 2045 |
|---|---|---|---|---|---|---|---|---|---|---|
| Hospitality | 16.1 | 16.8 | 17.5 | 18.2 | 18.9 | 37.1 | 37.1 | 37.1 | 37.1 | 37.1 |
| Real Estate | 67.4 | 0.0 | 0.0 | 0.0 | 0.0 | 0.0 | 0.0 | 0.0 | 0.0 | 0.0 |
| Entertainment | 24.9 | 26.2 | 27.6 | 29.0 | 30.5 | 32.0 | 33.6 | 35.3 | 37.0 | 38.7 |
| Events | 7.7 | 7.7 | 7.7 | 7.7 | 7.7 | 7.7 | 7.7 | 7.7 | 7.7 | 7.7 |
| Income | 0.0 | 0.0 | 0.0 | 0.0 | 0.0 | 0.0 | 0.0 | 0.0 | 0.0 | 0.0 |
| Cash flow for the year | 116.1 | 50.8 | 52.8 | 55.0 | 57.2 | 76.9 | 78.5 | 80.1 | 81.8 | 83.6 |
| Cash flow for the year · US$ MM | 23.2 | 10.2 | 10.6 | 11.0 | 11.4 | 15.4 | 15.7 | 16.0 | 16.4 | 16.7 |
| Cumulative | 594.3 | 645.1 | 697.9 | 752.9 | 810.0 | 886.9 | 965.4 | 1.045.5 | 1.127.4 | 1.211.0 |
| Cumulative · US$ MM | 118.9 | 129.0 | 139.6 | 150.6 | 162.0 | 177.4 | 193.1 | 209.1 | 225.5 | 242.2 |
Estimated projection. R$ million, nominal, excluding land cost. Real Estate = Villas + Land Lots + Apartments; Events = WDC + Convention Center; Income = Mini Mall + Senior Living. Source: MANAGEMENT tab.
Cumulative cash position Estimated projection
Peak exposure of R$ 432 MM in 2029
Estimated projection. Grey bars: negative cumulative cash; orange: positive. R$ million, cash flows excluding land cost.
data-src in this blockBusiness 01 · Hospitality Estimated projection
Club Med Gramado
A 250-room resort on 40 thousand m² — the Serra Gaúcha's only luxury all-inclusive with a global brand, under an 18-year BTS contract.
Guaranteed income with occupancy upside
| Assumption | Value |
|---|---|
| Contract | 18-year BTS with Club Med |
| Fixed rent | R$ 31 MM/year |
| Variable rent | up to R$ 23.5 MM/year, above 54% occupancy |
| Occupancy | 68% in 2028 → 80% from 2033 |
| Capex | R$ 450.8 MM (construction R$ 319 MM; FF&E R$ 101.5 MM) |
| Financing | R$ 210 MM PROGRANTUR · 10% p.a. · 12 years |
| Key money | R$ 30 MM advanced by Club Med |
| Tax regime | Presumed Profit |
Estimated projection. Levered equity IRR. Valuation: 2033 income ÷ 5.5% cap rate = R$ 675.8 MM.
Estimated projection · Annual cash flow · R$ MM · minimum (137.9) in 2027 · maximum 37.1 in 2041
Annual cash flow · Club Med Gramado
| Project cash flow | 2026 | 2027 | 2028 | 2029 | 2030 | 2031 | 2032 | 2033 | 2034 | 2035 | 2036 | 2037 | 2038 | 2039 | 2040 | 2041 | 2042 | 2043 | 2044 | 2045 |
|---|---|---|---|---|---|---|---|---|---|---|---|---|---|---|---|---|---|---|---|---|
| R$ MM | (84.5) | (137.9) | 15.4 | 5.1 | 1.3 | 11.2 | 12.0 | 13.9 | 14.6 | 15.4 | 16.1 | 16.8 | 17.5 | 18.2 | 18.9 | 37.1 | 37.1 | 37.1 | 37.1 | 37.1 |
| US$ MM | (16.9) | (27.6) | 3.1 | 1.0 | 0.3 | 2.2 | 2.4 | 2.8 | 2.9 | 3.1 | 3.2 | 3.4 | 3.5 | 3.6 | 3.8 | 7.4 | 7.4 | 7.4 | 7.4 | 7.4 |
| Cumulative R$ MM | (84.5) | (222.4) | (207.0) | (201.9) | (200.5) | (189.3) | (177.4) | (163.4) | (148.8) | (133.4) | (117.4) | (100.6) | (83.1) | (64.9) | (46.0) | (8.8) | 28.3 | 65.5 | 102.6 | 139.8 |
| Cumulative US$ MM | (16.9) | (44.5) | (41.4) | (40.4) | (40.1) | (37.9) | (35.5) | (32.7) | (29.8) | (26.7) | (23.5) | (20.1) | (16.6) | (13.0) | (9.2) | (1.8) | 5.7 | 13.1 | 20.5 | 28.0 |
Estimated projection. R$ million nominal and US$ million at R$ 5.00/US$; equity cash flow, excluding land cost. Source: MANAGEMENT tab.
Construction progress
Construction is already 20% complete
data-src in this blockAerial view from September 2026: steel structure of the accommodation blocks erected, foundations and slabs of the central building under way, access roads and platforms completed.
Phase 1 completed
Demolition and earthworks completed by RFM
Civil works
HTB Engenharia + Tedesco (ZECH group), guaranteed maximum price
R$ 150 MM invested
land paid in cash and works executed, before financing
Investor return with IPCA
25% of the hotel: 10.1% p.a. with the contract indexation
| Assumption | Value |
|---|---|
| Contribution | R$ 168.9 MM (US$ 33.8 MM) in 2026, for 25% of the hotel |
| Income | 25% of operating income after tax, from 2027 |
| Unencumbered | no capex and no debt; both stay with the Group |
| Indexation | IPCA of 5.68% p.a. (model assumption) on income from 2028 |
| Occupancy | 68% in 2028 → 80% from 2033 |
| Perpetuity | 2045 income ÷ 5.5% cap rate |
| Investor return | With IPCA |
|---|---|
| IRR | 10.1% |
| Income 2027–2045 ÷ contribution | 1.72x |
| Yield in 2033 · 2045 | 7.7% · 14.9% |
Estimated projection · Investor annual income · R$ MM · with the contract indexed to IPCA
The BTS contract provides for IPCA indexation. The model keeps nominal income flat; this simulation applies the indexation only to the investor's cash flow, without changing the hotel's value.
Estimated projection. R$ million. Simulation on the CLUB MED INVESTOR tab, excluding the R$ 30 MM structuring fee. Contribution kept at a 5.5% cap rate on 2033 nominal income. Indexation of 5.68% p.a. from 2028.
data-src in this blockBusiness 02 · Real Estate Estimated projection
Club Med Villas
26 houses finished to the hotel's standard, with pool, tennis court and concierge — sold to investors with access to Club Med's facilities.
Short cycle: launch in 2027, keys in 2029
| Assumption | Value |
|---|---|
| Product | 26 houses: 3 two-bed, 14 three-bed and 9 four-bed |
| Private area | 5,769 m² (average 222 m²) |
| Average price | R$ 24,755/m² · sales value R$ 142.8 MM |
| Construction | R$ 13,000/m² + R$ 5.6 MM of infrastructure |
| Term | 24 months, from Jan/27 to Jan/29 |
| Sales | 40% at launch, 45% during construction, 15% after keys |
| Payment | 30% down payment, 50% monthly, 20% at keys |
| Structure | Unlevered and no bank mortgage transfer |
Estimated projection. Margin on sales value. Valuation = NPV at 9% p.a. Source: VILLAS and MANAGEMENT tabs (Oct/2026).
Estimated projection · Annual cash flow · R$ MM · minimum (16.3) in 2027 · maximum 41.2 in 2029
Annual cash flow · Club Med Villas
| Project cash flow | 2026 | 2027 | 2028 | 2029 | 2030 | 2031 | 2032 | 2033 | 2034 | 2035 | 2036 | 2037 | 2038 | 2039 | 2040 | 2041 | 2042 | 2043 | 2044 | 2045 |
|---|---|---|---|---|---|---|---|---|---|---|---|---|---|---|---|---|---|---|---|---|
| R$ MM | (1.2) | (16.3) | 14.1 | 41.2 | 0.0 | 0.0 | 0.0 | 0.0 | 0.0 | 0.0 | 0.0 | 0.0 | 0.0 | 0.0 | 0.0 | 0.0 | 0.0 | 0.0 | 0.0 | 0.0 |
| US$ MM | (0.2) | (3.3) | 2.8 | 8.2 | 0.0 | 0.0 | 0.0 | 0.0 | 0.0 | 0.0 | 0.0 | 0.0 | 0.0 | 0.0 | 0.0 | 0.0 | 0.0 | 0.0 | 0.0 | 0.0 |
| Cumulative R$ MM | (1.2) | (17.5) | (3.4) | 37.8 | 37.8 | 37.8 | 37.8 | 37.8 | 37.8 | 37.8 | 37.8 | 37.8 | 37.8 | 37.8 | 37.8 | 37.8 | 37.8 | 37.8 | 37.8 | 37.8 |
| Cumulative US$ MM | (0.2) | (3.5) | (0.7) | 7.6 | 7.6 | 7.6 | 7.6 | 7.6 | 7.6 | 7.6 | 7.6 | 7.6 | 7.6 | 7.6 | 7.6 | 7.6 | 7.6 | 7.6 | 7.6 | 7.6 |
Estimated projection. R$ million nominal and US$ million at R$ 5.00/US$; equity cash flow, excluding land cost. Source: MANAGEMENT tab.
data-src in this blockBusiness 03 · Entertainment Estimated projection
Ski Gramado
South America's first all-season ski complex: slope, tubing, lessons, treetop course, zipline and dining, open all year round.
Recurring revenue that grows with visitation, debt-free
| Assumption | Value |
|---|---|
| Visitors | 213 thousand in the 1st full year (+10% vs. baseline) · +2% p.a. |
| General ticket | R$ 120 per visitor |
| Gross revenue | R$ 47.7 MM (2030) → R$ 80.3 MM (2045) |
| EBITDA | R$ 23.7 MM (2030) → R$ 48.3 MM (2045) |
| Capex | R$ 136 MM (+ R$ 10 MM of reinvestment) · construction 2028–29 |
| Operations | from 2029 · 311 days per year |
| Financing | unlevered · 100% equity |
| Fixed costs | ~R$ 16.2 MM/year (staff, contracts, power) |
Estimated projection. Equity IRR, unlevered. Valuation: PV of cash flows through 2041 + PV of 2042 income ÷ 5.5% cap rate.
Estimated projection · Annual cash flow · R$ MM · minimum (78.9) in 2029 · maximum 38.7 in 2045
Annual cash flow · Ski Gramado
| Project cash flow | 2026 | 2027 | 2028 | 2029 | 2030 | 2031 | 2032 | 2033 | 2034 | 2035 | 2036 | 2037 | 2038 | 2039 | 2040 | 2041 | 2042 | 2043 | 2044 | 2045 |
|---|---|---|---|---|---|---|---|---|---|---|---|---|---|---|---|---|---|---|---|---|
| R$ MM | 0.0 | 0.0 | (54.4) | (78.9) | 18.0 | 19.1 | 20.1 | 21.3 | 22.4 | 23.7 | 24.9 | 26.2 | 27.6 | 29.0 | 30.5 | 32.0 | 33.6 | 35.3 | 37.0 | 38.7 |
| US$ MM | 0.0 | 0.0 | (10.9) | (15.8) | 3.6 | 3.8 | 4.0 | 4.3 | 4.5 | 4.7 | 5.0 | 5.2 | 5.5 | 5.8 | 6.1 | 6.4 | 6.7 | 7.1 | 7.4 | 7.7 |
| Cumulative R$ MM | 0.0 | 0.0 | (54.4) | (133.3) | (115.3) | (96.2) | (76.1) | (54.8) | (32.3) | (8.7) | 16.2 | 42.5 | 70.1 | 99.1 | 129.6 | 161.6 | 195.3 | 230.5 | 267.5 | 306.2 |
| Cumulative US$ MM | 0.0 | 0.0 | (10.9) | (26.7) | (23.1) | (19.2) | (15.2) | (11.0) | (6.5) | (1.7) | 3.2 | 8.5 | 14.0 | 19.8 | 25.9 | 32.3 | 39.1 | 46.1 | 53.5 | 61.2 |
Estimated projection. R$ million nominal and US$ million at R$ 5.00/US$; equity cash flow, excluding land cost. Source: MANAGEMENT tab.
data-src in this blockBusiness 04 · Events Estimated projection
WDC Weddings
A wedding and celebration venue inside the complex, making Gramado a wedding destination with Club Med's facilities next door.
Lean capex and four-year payback
| Assumption | Value |
|---|---|
| Capex | R$ 16.6 MM (construction and infrastructure + 4% fee) |
| Schedule | construction in 2027 · operations from 2028 |
| Events | 112 in the 1st year → 202 in the 5th year |
| Average ticket | R$ 43.8 thousand → R$ 59.4 thousand per event |
| Gross revenue | R$ 6.2 MM → R$ 14.5 MM per year |
| Result | R$ 7.7 MM/year stabilized (53% of revenue) |
| Scenario | realistic case of the WDC Gramado business plan |
| Structure | unlevered |
Estimated projection. Project IRR, unlevered. Valuation: 5.5% cap rate at stabilization (2031).
Estimated projection · Annual cash flow · R$ MM · minimum (16.6) in 2027 · maximum 7.7 in 2032
Annual cash flow · WDC Weddings
| Project cash flow | 2026 | 2027 | 2028 | 2029 | 2030 | 2031 | 2032 | 2033 | 2034 | 2035 | 2036 | 2037 | 2038 | 2039 | 2040 | 2041 | 2042 | 2043 | 2044 | 2045 |
|---|---|---|---|---|---|---|---|---|---|---|---|---|---|---|---|---|---|---|---|---|
| R$ MM | 0.0 | (16.6) | 2.7 | 4.0 | 5.0 | 6.3 | 7.7 | 7.7 | 7.7 | 7.7 | 7.7 | 7.7 | 7.7 | 7.7 | 7.7 | 7.7 | 7.7 | 7.7 | 7.7 | 7.7 |
| US$ MM | 0.0 | (3.3) | 0.5 | 0.8 | 1.0 | 1.3 | 1.5 | 1.5 | 1.5 | 1.5 | 1.5 | 1.5 | 1.5 | 1.5 | 1.5 | 1.5 | 1.5 | 1.5 | 1.5 | 1.5 |
| Cumulative R$ MM | 0.0 | (16.6) | (14.0) | (10.0) | (5.0) | 1.3 | 9.0 | 16.7 | 24.5 | 32.2 | 39.9 | 47.7 | 55.4 | 63.1 | 70.9 | 78.6 | 86.3 | 94.1 | 101.8 | 109.5 |
| Cumulative US$ MM | 0.0 | (3.3) | (2.8) | (2.0) | (1.0) | 0.3 | 1.8 | 3.3 | 4.9 | 6.4 | 8.0 | 9.5 | 11.1 | 12.6 | 14.2 | 15.7 | 17.3 | 18.8 | 20.4 | 21.9 |
Estimated projection. R$ million nominal and US$ million at R$ 5.00/US$; equity cash flow, excluding land cost. Source: MANAGEMENT tab.
data-src in this blockBusiness 05 · Income Estimated projection
Mini Mall
Convenience center between the civic squares, with shops, services and about 40 parking spaces — an income asset retained by the Group.
Build, operate for three years and sell stabilized
| Assumption | Value |
|---|---|
| Land | 3,130 m² (Zone 10.2) |
| Built area | 3,220 m², with a ~40-space basement |
| ABL | 1.750 m² |
| Rent | R$ 140/m²/month → R$ 2.94 MM/year |
| Key money | 6 months' rent on the smaller shops |
| Capex | R$ 21.8 MM (R$ 6,500/m²) in 2027 |
| Lease-up | 70% of rent in 2028 |
| Sale | to an investor in 2030, for R$ 29.8 MM (9.3% cap rate for the buyer) |
| EBITDA | ~R$ 2.8 MM/year |
Estimated projection. MANAGEMENT and VALUATION scenario: build, operate for three years and sell the stabilized asset in 2030. Valuation = NPV of cash flows at 9% p.a.
Estimated projection · Annual cash flow · R$ MM · minimum (21.8) in 2027 · maximum 30.2 in 2030
Annual cash flow · Mini Mall
| Project cash flow | 2026 | 2027 | 2028 | 2029 | 2030 | 2031 | 2032 | 2033 | 2034 | 2035 | 2036 | 2037 | 2038 | 2039 | 2040 | 2041 | 2042 | 2043 | 2044 | 2045 |
|---|---|---|---|---|---|---|---|---|---|---|---|---|---|---|---|---|---|---|---|---|
| R$ MM | 0.0 | (21.8) | 2.2 | 2.1 | 30.2 | 0.0 | 0.0 | 0.0 | 0.0 | 0.0 | 0.0 | 0.0 | 0.0 | 0.0 | 0.0 | 0.0 | 0.0 | 0.0 | 0.0 | 0.0 |
| US$ MM | 0.0 | (4.4) | 0.4 | 0.4 | 6.0 | 0.0 | 0.0 | 0.0 | 0.0 | 0.0 | 0.0 | 0.0 | 0.0 | 0.0 | 0.0 | 0.0 | 0.0 | 0.0 | 0.0 | 0.0 |
| Cumulative R$ MM | 0.0 | (21.8) | (19.5) | (17.4) | 12.8 | 12.8 | 12.8 | 12.8 | 12.8 | 12.8 | 12.8 | 12.8 | 12.8 | 12.8 | 12.8 | 12.8 | 12.8 | 12.8 | 12.8 | 12.8 |
| Cumulative US$ MM | 0.0 | (4.4) | (3.9) | (3.5) | 2.6 | 2.6 | 2.6 | 2.6 | 2.6 | 2.6 | 2.6 | 2.6 | 2.6 | 2.6 | 2.6 | 2.6 | 2.6 | 2.6 | 2.6 | 2.6 |
Estimated projection. R$ million nominal and US$ million at R$ 5.00/US$; equity cash flow, excluding land cost. Source: MANAGEMENT tab.
data-src in this blockBusiness 06 · Real Estate Estimated projection
Land Lots
372 lots of 800 to 2,000 m² in 13 gated communities and villages, 10 of them with a clubhouse, launched in three phases.
Three phases and R$ 1.06 bn of sales value
| Assumption | Value |
|---|---|
| Lots | 93 · 192 · 87 per phase |
| Average price | R$ 2,175 to 2,567/m² of lot |
| Construction | R$ 500/m² (+10% per phase) and clubhouses |
| Launches | Jan/28, Jan/30 and Jan/32 |
| Construction period | 30 months per phase |
| Sales | 40% at launch, 40% during construction, 20% after delivery |
| Collection | 35% until delivery, 65% at bank transfer |
| Financing | 60% of construction at 12% p.a. |
Estimated projection. R$ MM, levered scenario. Total: consolidated exposure, multiple on the capital of the 3 phases. Valuation: R$ 166.7 MM.
| Phase | Sales value | IRR | Exposure | Result | Multiple |
|---|---|---|---|---|---|
| F01 | 179.7 | 50.7% | (34.7) | 57.2 | 2.65x |
| F02 | 465.9 | 72.3% | (69.5) | 184.1 | 3.65x |
| F03 | 418.0 | 40.0% | (96.8) | 111.2 | 2.15x |
| Total | 1.063.5 | 57.3% | (52.7) | 352.5 | 2.75x |
Estimated projection · Annual cash flow · R$ MM · minimum (29.1) in 2029 · maximum 208.0 in 2035
Annual cash flow · Land Lots · consolidated 3 phases
| Project cash flow | 2026 | 2027 | 2028 | 2029 | 2030 | 2031 | 2032 | 2033 | 2034 | 2035 | 2036 | 2037 | 2038 | 2039 | 2040 | 2041 | 2042 | 2043 | 2044 | 2045 |
|---|---|---|---|---|---|---|---|---|---|---|---|---|---|---|---|---|---|---|---|---|
| R$ MM | 0.0 | (1.5) | (7.8) | (29.1) | (14.4) | 36.9 | (11.0) | 176.4 | (5.0) | 208.0 | 0.0 | 0.0 | 0.0 | 0.0 | 0.0 | 0.0 | 0.0 | 0.0 | 0.0 | 0.0 |
| US$ MM | 0.0 | (0.3) | (1.6) | (5.8) | (2.9) | 7.4 | (2.2) | 35.3 | (1.0) | 41.6 | 0.0 | 0.0 | 0.0 | 0.0 | 0.0 | 0.0 | 0.0 | 0.0 | 0.0 | 0.0 |
| Cumulative R$ MM | 0.0 | (1.5) | (9.2) | (38.3) | (52.7) | (15.8) | (26.8) | 149.6 | 144.5 | 352.5 | 352.5 | 352.5 | 352.5 | 352.5 | 352.5 | 352.5 | 352.5 | 352.5 | 352.5 | 352.5 |
| Cumulative US$ MM | 0.0 | (0.3) | (1.8) | (7.7) | (10.5) | (3.2) | (5.4) | 29.9 | 28.9 | 70.5 | 70.5 | 70.5 | 70.5 | 70.5 | 70.5 | 70.5 | 70.5 | 70.5 | 70.5 | 70.5 |
Phase 01 · IRR 50.7% · exposure R$ 34.7 MM · result R$ 57.2 MM
| Phase 01 | 2026 | 2027 | 2028 | 2029 | 2030 | 2031 | 2032 | 2033 | 2034 | 2035 | 2036 | 2037 | 2038 | 2039 | 2040 | 2041 | 2042 | 2043 | 2044 | 2045 |
|---|---|---|---|---|---|---|---|---|---|---|---|---|---|---|---|---|---|---|---|---|
| R$ MM | 0.0 | (1.5) | (7.8) | (25.4) | 0.1 | 91.7 | 0.0 | 0.0 | 0.0 | 0.0 | 0.0 | 0.0 | 0.0 | 0.0 | 0.0 | 0.0 | 0.0 | 0.0 | 0.0 | 0.0 |
| US$ MM | 0.0 | (0.3) | (1.6) | (5.1) | 0.0 | 18.3 | 0.0 | 0.0 | 0.0 | 0.0 | 0.0 | 0.0 | 0.0 | 0.0 | 0.0 | 0.0 | 0.0 | 0.0 | 0.0 | 0.0 |
| Cumulative R$ MM | 0.0 | (1.5) | (9.2) | (34.7) | (34.5) | 57.2 | 57.2 | 57.2 | 57.2 | 57.2 | 57.2 | 57.2 | 57.2 | 57.2 | 57.2 | 57.2 | 57.2 | 57.2 | 57.2 | 57.2 |
| Cumulative US$ MM | 0.0 | (0.3) | (1.8) | (6.9) | (6.9) | 11.4 | 11.4 | 11.4 | 11.4 | 11.4 | 11.4 | 11.4 | 11.4 | 11.4 | 11.4 | 11.4 | 11.4 | 11.4 | 11.4 | 11.4 |
Phase 02 · IRR 72.3% · exposure R$ 69.5 MM · result R$ 184.1 MM
| Phase 02 | 2026 | 2027 | 2028 | 2029 | 2030 | 2031 | 2032 | 2033 | 2034 | 2035 | 2036 | 2037 | 2038 | 2039 | 2040 | 2041 | 2042 | 2043 | 2044 | 2045 |
|---|---|---|---|---|---|---|---|---|---|---|---|---|---|---|---|---|---|---|---|---|
| R$ MM | 0.0 | 0.0 | 0.0 | (3.7) | (14.5) | (51.3) | 7.7 | 246.0 | 0.0 | 0.0 | 0.0 | 0.0 | 0.0 | 0.0 | 0.0 | 0.0 | 0.0 | 0.0 | 0.0 | 0.0 |
| US$ MM | 0.0 | 0.0 | 0.0 | (0.7) | (2.9) | (10.3) | 1.5 | 49.2 | 0.0 | 0.0 | 0.0 | 0.0 | 0.0 | 0.0 | 0.0 | 0.0 | 0.0 | 0.0 | 0.0 | 0.0 |
| Cumulative R$ MM | 0.0 | 0.0 | 0.0 | (3.7) | (18.2) | (69.5) | (61.9) | 184.1 | 184.1 | 184.1 | 184.1 | 184.1 | 184.1 | 184.1 | 184.1 | 184.1 | 184.1 | 184.1 | 184.1 | 184.1 |
| Cumulative US$ MM | 0.0 | 0.0 | 0.0 | (0.7) | (3.6) | (13.9) | (12.4) | 36.8 | 36.8 | 36.8 | 36.8 | 36.8 | 36.8 | 36.8 | 36.8 | 36.8 | 36.8 | 36.8 | 36.8 | 36.8 |
Phase 03 · IRR 40.0% · exposure R$ 96.8 MM · result R$ 111.2 MM
| Phase 03 | 2026 | 2027 | 2028 | 2029 | 2030 | 2031 | 2032 | 2033 | 2034 | 2035 | 2036 | 2037 | 2038 | 2039 | 2040 | 2041 | 2042 | 2043 | 2044 | 2045 |
|---|---|---|---|---|---|---|---|---|---|---|---|---|---|---|---|---|---|---|---|---|
| R$ MM | 0.0 | 0.0 | 0.0 | 0.0 | 0.0 | (3.5) | (18.7) | (69.6) | (5.0) | 208.0 | 0.0 | 0.0 | 0.0 | 0.0 | 0.0 | 0.0 | 0.0 | 0.0 | 0.0 | 0.0 |
| US$ MM | 0.0 | 0.0 | 0.0 | 0.0 | 0.0 | (0.7) | (3.7) | (13.9) | (1.0) | 41.6 | 0.0 | 0.0 | 0.0 | 0.0 | 0.0 | 0.0 | 0.0 | 0.0 | 0.0 | 0.0 |
| Cumulative R$ MM | 0.0 | 0.0 | 0.0 | 0.0 | 0.0 | (3.5) | (22.1) | (91.7) | (96.8) | 111.2 | 111.2 | 111.2 | 111.2 | 111.2 | 111.2 | 111.2 | 111.2 | 111.2 | 111.2 | 111.2 |
| Cumulative US$ MM | 0.0 | 0.0 | 0.0 | 0.0 | 0.0 | (0.7) | (4.4) | (18.3) | (19.4) | 22.2 | 22.2 | 22.2 | 22.2 | 22.2 | 22.2 | 22.2 | 22.2 | 22.2 | 22.2 | 22.2 |
Estimated projection. R$ million nominal and US$ million at R$ 5.00/US$; equity cash flow, excluding land cost. Source: MANAGEMENT tab.
data-src in this blockBusiness 07 · Real Estate Estimated projection
Apartments (Surf Village)
About 257 apartments of 75 to 260 m² (average 140 m²) in three phases. The wave pool and the 60-key Surf Lodge remain options for the investor.
Price rises 15% each phase
| Assumption | Value |
|---|---|
| Units | 86 · 86 · 85 per phase |
| Price | R$ 23.000 → 26.450 → 30.417/m² |
| Construction | R$ 8,000/m² (+10% per phase) |
| Launches | Jan/28, Jan/30 and Jan/32 |
| Construction period | 36 months per phase |
| Sales | 30% at launch, 60% during construction, 10% after keys |
| Collection | 50% until keys, 50% at bank transfer |
| Financing | 60% of construction at 12% p.a. |
Estimated projection. R$ MM, levered scenario. Total: consolidated exposure, multiple on the capital of the 3 phases. Valuation: R$ 106.7 MM.
| Phase | Sales value | IRR | Exposure | Result | Multiple |
|---|---|---|---|---|---|
| F01 | 276.9 | 42.1% | (43.9) | 60.6 | 2.38x |
| F02 | 318.5 | 48.2% | (47.2) | 78.5 | 2.66x |
| F03 | 362.0 | 54.4% | (50.1) | 98.7 | 2.97x |
| Total | 957.3 | 45.8% | (47.2) | 237.8 | 2.68x |
Estimated projection · Annual cash flow · R$ MM · minimum (39.4) in 2029 · maximum 78.9 in 2034
Annual cash flow · Apartments (Surf Village) · consolidated 3 phases
| Project cash flow | 2026 | 2027 | 2028 | 2029 | 2030 | 2031 | 2032 | 2033 | 2034 | 2035 | 2036 | 2037 | 2038 | 2039 | 2040 | 2041 | 2042 | 2043 | 2044 | 2045 |
|---|---|---|---|---|---|---|---|---|---|---|---|---|---|---|---|---|---|---|---|---|
| R$ MM | 0.0 | (3.0) | (4.9) | (39.4) | 12.6 | 0.5 | 59.6 | 8.6 | 78.9 | 57.4 | 67.4 | 0.0 | 0.0 | 0.0 | 0.0 | 0.0 | 0.0 | 0.0 | 0.0 | 0.0 |
| US$ MM | 0.0 | (0.6) | (1.0) | (7.9) | 2.5 | 0.1 | 11.9 | 1.7 | 15.8 | 11.5 | 13.5 | 0.0 | 0.0 | 0.0 | 0.0 | 0.0 | 0.0 | 0.0 | 0.0 | 0.0 |
| Cumulative R$ MM | 0.0 | (3.0) | (7.9) | (47.2) | (34.6) | (34.1) | 25.4 | 34.1 | 113.0 | 170.4 | 237.8 | 237.8 | 237.8 | 237.8 | 237.8 | 237.8 | 237.8 | 237.8 | 237.8 | 237.8 |
| Cumulative US$ MM | 0.0 | (0.6) | (1.6) | (9.4) | (6.9) | (6.8) | 5.1 | 6.8 | 22.6 | 34.1 | 47.6 | 47.6 | 47.6 | 47.6 | 47.6 | 47.6 | 47.6 | 47.6 | 47.6 | 47.6 |
Phase 01 · IRR 42.1% · exposure R$ 43.9 MM · result R$ 60.6 MM
| Phase 01 | 2026 | 2027 | 2028 | 2029 | 2030 | 2031 | 2032 | 2033 | 2034 | 2035 | 2036 | 2037 | 2038 | 2039 | 2040 | 2041 | 2042 | 2043 | 2044 | 2045 |
|---|---|---|---|---|---|---|---|---|---|---|---|---|---|---|---|---|---|---|---|---|
| R$ MM | 0.0 | (3.0) | (4.9) | (36.0) | 17.6 | 43.1 | 43.9 | 0.0 | 0.0 | 0.0 | 0.0 | 0.0 | 0.0 | 0.0 | 0.0 | 0.0 | 0.0 | 0.0 | 0.0 | 0.0 |
| US$ MM | 0.0 | (0.6) | (1.0) | (7.2) | 3.5 | 8.6 | 8.8 | 0.0 | 0.0 | 0.0 | 0.0 | 0.0 | 0.0 | 0.0 | 0.0 | 0.0 | 0.0 | 0.0 | 0.0 | 0.0 |
| Cumulative R$ MM | 0.0 | (3.0) | (7.9) | (43.9) | (26.3) | 16.7 | 60.6 | 60.6 | 60.6 | 60.6 | 60.6 | 60.6 | 60.6 | 60.6 | 60.6 | 60.6 | 60.6 | 60.6 | 60.6 | 60.6 |
| Cumulative US$ MM | 0.0 | (0.6) | (1.6) | (8.8) | (5.3) | 3.3 | 12.1 | 12.1 | 12.1 | 12.1 | 12.1 | 12.1 | 12.1 | 12.1 | 12.1 | 12.1 | 12.1 | 12.1 | 12.1 | 12.1 |
Phase 02 · IRR 48.2% · exposure R$ 47.2 MM · result R$ 78.5 MM
| Phase 02 | 2026 | 2027 | 2028 | 2029 | 2030 | 2031 | 2032 | 2033 | 2034 | 2035 | 2036 | 2037 | 2038 | 2039 | 2040 | 2041 | 2042 | 2043 | 2044 | 2045 |
|---|---|---|---|---|---|---|---|---|---|---|---|---|---|---|---|---|---|---|---|---|
| R$ MM | 0.0 | 0.0 | 0.0 | (3.4) | (5.0) | (38.8) | 20.7 | 50.0 | 55.0 | 0.0 | 0.0 | 0.0 | 0.0 | 0.0 | 0.0 | 0.0 | 0.0 | 0.0 | 0.0 | 0.0 |
| US$ MM | 0.0 | 0.0 | 0.0 | (0.7) | (1.0) | (7.8) | 4.1 | 10.0 | 11.0 | 0.0 | 0.0 | 0.0 | 0.0 | 0.0 | 0.0 | 0.0 | 0.0 | 0.0 | 0.0 | 0.0 |
| Cumulative R$ MM | 0.0 | 0.0 | 0.0 | (3.4) | (8.3) | (47.2) | (26.5) | 23.5 | 78.5 | 78.5 | 78.5 | 78.5 | 78.5 | 78.5 | 78.5 | 78.5 | 78.5 | 78.5 | 78.5 | 78.5 |
| Cumulative US$ MM | 0.0 | 0.0 | 0.0 | (0.7) | (1.7) | (9.4) | (5.3) | 4.7 | 15.7 | 15.7 | 15.7 | 15.7 | 15.7 | 15.7 | 15.7 | 15.7 | 15.7 | 15.7 | 15.7 | 15.7 |
Phase 03 · IRR 54.4% · exposure R$ 50.1 MM · result R$ 98.7 MM
| Phase 03 | 2026 | 2027 | 2028 | 2029 | 2030 | 2031 | 2032 | 2033 | 2034 | 2035 | 2036 | 2037 | 2038 | 2039 | 2040 | 2041 | 2042 | 2043 | 2044 | 2045 |
|---|---|---|---|---|---|---|---|---|---|---|---|---|---|---|---|---|---|---|---|---|
| R$ MM | 0.0 | 0.0 | 0.0 | 0.0 | 0.0 | (3.7) | (5.0) | (41.4) | 24.0 | 57.4 | 67.4 | 0.0 | 0.0 | 0.0 | 0.0 | 0.0 | 0.0 | 0.0 | 0.0 | 0.0 |
| US$ MM | 0.0 | 0.0 | 0.0 | 0.0 | 0.0 | (0.7) | (1.0) | (8.3) | 4.8 | 11.5 | 13.5 | 0.0 | 0.0 | 0.0 | 0.0 | 0.0 | 0.0 | 0.0 | 0.0 | 0.0 |
| Cumulative R$ MM | 0.0 | 0.0 | 0.0 | 0.0 | 0.0 | (3.7) | (8.7) | (50.1) | (26.1) | 31.3 | 98.7 | 98.7 | 98.7 | 98.7 | 98.7 | 98.7 | 98.7 | 98.7 | 98.7 | 98.7 |
| Cumulative US$ MM | 0.0 | 0.0 | 0.0 | 0.0 | 0.0 | (0.7) | (1.7) | (10.0) | (5.2) | 6.3 | 19.7 | 19.7 | 19.7 | 19.7 | 19.7 | 19.7 | 19.7 | 19.7 | 19.7 | 19.7 |
Estimated projection. R$ million nominal and US$ million at R$ 5.00/US$; equity cash flow, excluding land cost. Source: MANAGEMENT tab.
Business 08 · Income Estimated projection
Senior Living
Senior living residence with services at the southern tip of the masterplan, next to the clinical complex, run by a specialized operator.
Building sold to the operator, with an 18% IRR
| Assumption | Value |
|---|---|
| Units | 90: 70% 45 m² studios, 60 m² 1-bedroom units |
| Built area | 8.000 m² a R$ 8.000/m² |
| Capex | R$ 75.7 MM, with FF&E of R$ 7.2 MM |
| Schedule | construction 2029–30 · operations in 2031 |
| Profile | 60% independent, 25% semi-dependent, 15% dependent |
| Monthly fee | average of R$ 9.95 thousand per month |
| Occupancy | 45% in the 1st year → 75% stabilized |
| Structure | sale to the operator at R$ 18,462/private m² |
Estimated projection. Sale price set for the Group's 18% target IRR. Valuation = NPV at 9% p.a. Source: SENIOR LIVING tab.
Estimated projection · Annual cash flow · R$ MM · minimum (18.1) in 2030 · maximum 38.3 in 2031
Annual cash flow · Senior Living
| Project cash flow | 2026 | 2027 | 2028 | 2029 | 2030 | 2031 | 2032 | 2033 | 2034 | 2035 | 2036 | 2037 | 2038 | 2039 | 2040 | 2041 | 2042 | 2043 | 2044 | 2045 |
|---|---|---|---|---|---|---|---|---|---|---|---|---|---|---|---|---|---|---|---|---|
| R$ MM | 0.0 | 0.0 | 0.0 | (12.1) | (18.1) | 38.3 | 0.0 | 0.0 | 0.0 | 0.0 | 0.0 | 0.0 | 0.0 | 0.0 | 0.0 | 0.0 | 0.0 | 0.0 | 0.0 | 0.0 |
| US$ MM | 0.0 | 0.0 | 0.0 | (2.4) | (3.6) | 7.7 | 0.0 | 0.0 | 0.0 | 0.0 | 0.0 | 0.0 | 0.0 | 0.0 | 0.0 | 0.0 | 0.0 | 0.0 | 0.0 | 0.0 |
| Cumulative R$ MM | 0.0 | 0.0 | 0.0 | (12.1) | (30.2) | 8.0 | 8.0 | 8.0 | 8.0 | 8.0 | 8.0 | 8.0 | 8.0 | 8.0 | 8.0 | 8.0 | 8.0 | 8.0 | 8.0 | 8.0 |
| Cumulative US$ MM | 0.0 | 0.0 | 0.0 | (2.4) | (6.0) | 1.6 | 1.6 | 1.6 | 1.6 | 1.6 | 1.6 | 1.6 | 1.6 | 1.6 | 1.6 | 1.6 | 1.6 | 1.6 | 1.6 | 1.6 |
Estimated projection. R$ million nominal and US$ million at R$ 5.00/US$; equity cash flow, excluding land cost. Source: MANAGEMENT tab.
Business 09 · Events Estimated projection
Convention Center
A mid-sized congress center integrated with Club Med, for congresses, fairs and corporate events — the region's largest events segment.
Building sold to the operator for R$ 67.5 MM
| Assumption | Value |
|---|---|
| Program | 1,200-seat auditorium, hall and 10 rooms |
| Market | 681 events and 272 thousand attendees per year in Gramado and Canela |
| Calendar | 116 events per year, stabilized |
| Operator revenue | ~R$ 27.7 MM/year (2026 prices) |
| Capex | R$ 56.2 MM (R$ 7,000/m²) · construction 2029–30 |
| Structure | sale to the operator at R$ 9,000/m² built |
| FF&E | borne by the operator |
Estimated projection. Sale price set for the Group's 18% target IRR. Valuation = NPV at 9% p.a. Source: CONVENTION CENTER tab.
Estimated projection · Annual cash flow · R$ MM · minimum (14.9) in 2030 · maximum 31.4 in 2031
Annual cash flow · Convention Center
| Project cash flow | 2026 | 2027 | 2028 | 2029 | 2030 | 2031 | 2032 | 2033 | 2034 | 2035 | 2036 | 2037 | 2038 | 2039 | 2040 | 2041 | 2042 | 2043 | 2044 | 2045 |
|---|---|---|---|---|---|---|---|---|---|---|---|---|---|---|---|---|---|---|---|---|
| R$ MM | 0.0 | 0.0 | 0.0 | (9.9) | (14.9) | 31.4 | 0.0 | 0.0 | 0.0 | 0.0 | 0.0 | 0.0 | 0.0 | 0.0 | 0.0 | 0.0 | 0.0 | 0.0 | 0.0 | 0.0 |
| US$ MM | 0.0 | 0.0 | 0.0 | (2.0) | (3.0) | 6.3 | 0.0 | 0.0 | 0.0 | 0.0 | 0.0 | 0.0 | 0.0 | 0.0 | 0.0 | 0.0 | 0.0 | 0.0 | 0.0 | 0.0 |
| Cumulative R$ MM | 0.0 | 0.0 | 0.0 | (9.9) | (24.8) | 6.6 | 6.6 | 6.6 | 6.6 | 6.6 | 6.6 | 6.6 | 6.6 | 6.6 | 6.6 | 6.6 | 6.6 | 6.6 | 6.6 | 6.6 |
| Cumulative US$ MM | 0.0 | 0.0 | 0.0 | (2.0) | (5.0) | 1.3 | 1.3 | 1.3 | 1.3 | 1.3 | 1.3 | 1.3 | 1.3 | 1.3 | 1.3 | 1.3 | 1.3 | 1.3 | 1.3 | 1.3 |
Estimated projection. R$ million nominal and US$ million at R$ 5.00/US$; equity cash flow, excluding land cost. Source: MANAGEMENT tab.
Market · demand
Gramado: growing demand and smoother seasonality
3rd most searched destination
vs. 2024 (Tourism Observatory)
vs. 3.0 nights in 2023
all-time record
Hotel occupancy by period (%) — SindTur Serra Gaúcha / Flutua, 2025–26
What it means for the investor
- Two high seasons (winter and Natal Luz) sustain occupancy all year round.
- New hotel permits suspended until Jan/2027: supply locked during the critical phase.
- Club Med's 250 rooms are ~1% of the city's ~24 thousand beds.
- Vila Oliva airport, 20 min away, expands the addressable market.
Sources: 2025 Tourism Yearbook — Gramado Tourism Observatory; SindTur Serra Gaúcha / Flutua; Tourism Department; Trivago.
Market · supply
High-end hotel rates in the region
| Development | Rooms | Reference nightly rate¹ | Model | Competitive notes |
|---|---|---|---|---|
| Castelo Saint Andrews (Gramado) | ~11 suites | ~R$ 3.200 | Exclusive house, half board | Ultra-boutique; minimal scale, no family facilities |
| Hotel Colline de France (Gramado) | 34 suites | R$ 1.500–3.000 | Boutique, lodging only | Voted best hotel in the world (TripAdvisor); downtown; no leisure/resort |
| Casa da Montanha / Wood Hotel (Gramado) | ~90 | R$ 1.100–1.700 | Upscale, breakfast included | Traditional downtown hotel; no all-inclusive |
| Kempinski Laje de Pedra (Canela) | 351–360 | US$ 550–600 (R$ ~3,000–3,300) | Luxury + residences / fractional | Opening Feb/2027; timeshare popularized the brand; outside Gramado |
| Club Med Gramado — Exclusive Collection | 250 | Premium all-inclusive | All-inclusive, BTS | The only luxury all-inclusive with a global brand and an integrated family offer |
Reference market (SindTur/Flutua, Easter 2026): Market average ADR of R$ 708 and RevPAR of R$ 473 — the luxury segment runs 2 to 4x above the city average. Today Gramado has no all-inclusive product and no international brand of Club Med's caliber.
Rack rates surveyed in Aug/2026 (Booking, aggregators, CNN V&G); exchange rate R$ 5.50/US$.
Operator
Club Med: proven and rising global occupancy
Average global room occupancy (%) — Club Med, annual reports
The model assumption (68% → 80% from 2033) is conservative against the track record: the chain already runs above 75% globally and Club Med's historical occupancy in Brazil (3 resorts) is around 75%. The demand study is Club Med's own, and it takes the brand risk on the asset.
Sources: Club Med Corporate — 2024 Results; Fosun International — 2023 and 2025 results.
Contracted revenue · Club Med BTS
Guaranteed floor with occupancy upside
| Occupancy | Fixed | Variable | Total |
|---|---|---|---|
| 68% · opening (2028) | 31.0 | 7.5 | 38.5 |
| 75% · global track record | 31.0 | 11.0 | 42.0 |
| 80% · target (2033+) | 31.0 | 13.5 | 44.5 |
| 100% · cap | 31.0 | 23.5 | 54.5 |
At the 80% target, revenue reaches R$ 44.5 MM per year, 43% above the floor.
Even without variable rent, the R$ 31 MM floor covers the projected debt service of up to R$ 25.4 MM per year.
R$ million per year, nominal. Source: Club Med BTS contract and the CLUB MED tab of the Financial Model (Oct/2026).
Governance
Project management team
Founding partner
Four decades in entertainment and real estate; R$ 1 bn+ of sales value. Bought the land in cash and stands behind the guarantees.
Marcelo Duarte · Family Office CEO
Finance executive (ex-Natura, Vale, MRS Logística); responsible for the capital structure.
Jaime · Project CEO
Partner at Star Ópera; leads the works and the relationship with Club Med and the contractor.
Paulo Geraldo · Board member
Has managed the group's international liquidity for 20 years; credit banking background.
Dra. Carolina · Operations
Legal and operations of the Family Office; Club Med, HTB Tedesco and Brazilian Host contracts.
Felipe Arlindo and Gustavo Mourão
Feasibility and development (Felipe); financial modeling and Sirena Asset (Gustavo).
Structure strengthened in 2024–25 with the creation of Grupo Sirena (Family Office) and Sirena Asset.